The Menu Pricing Mistake Costing Restaurants Thousands: Static Prices in a Dynamic Market

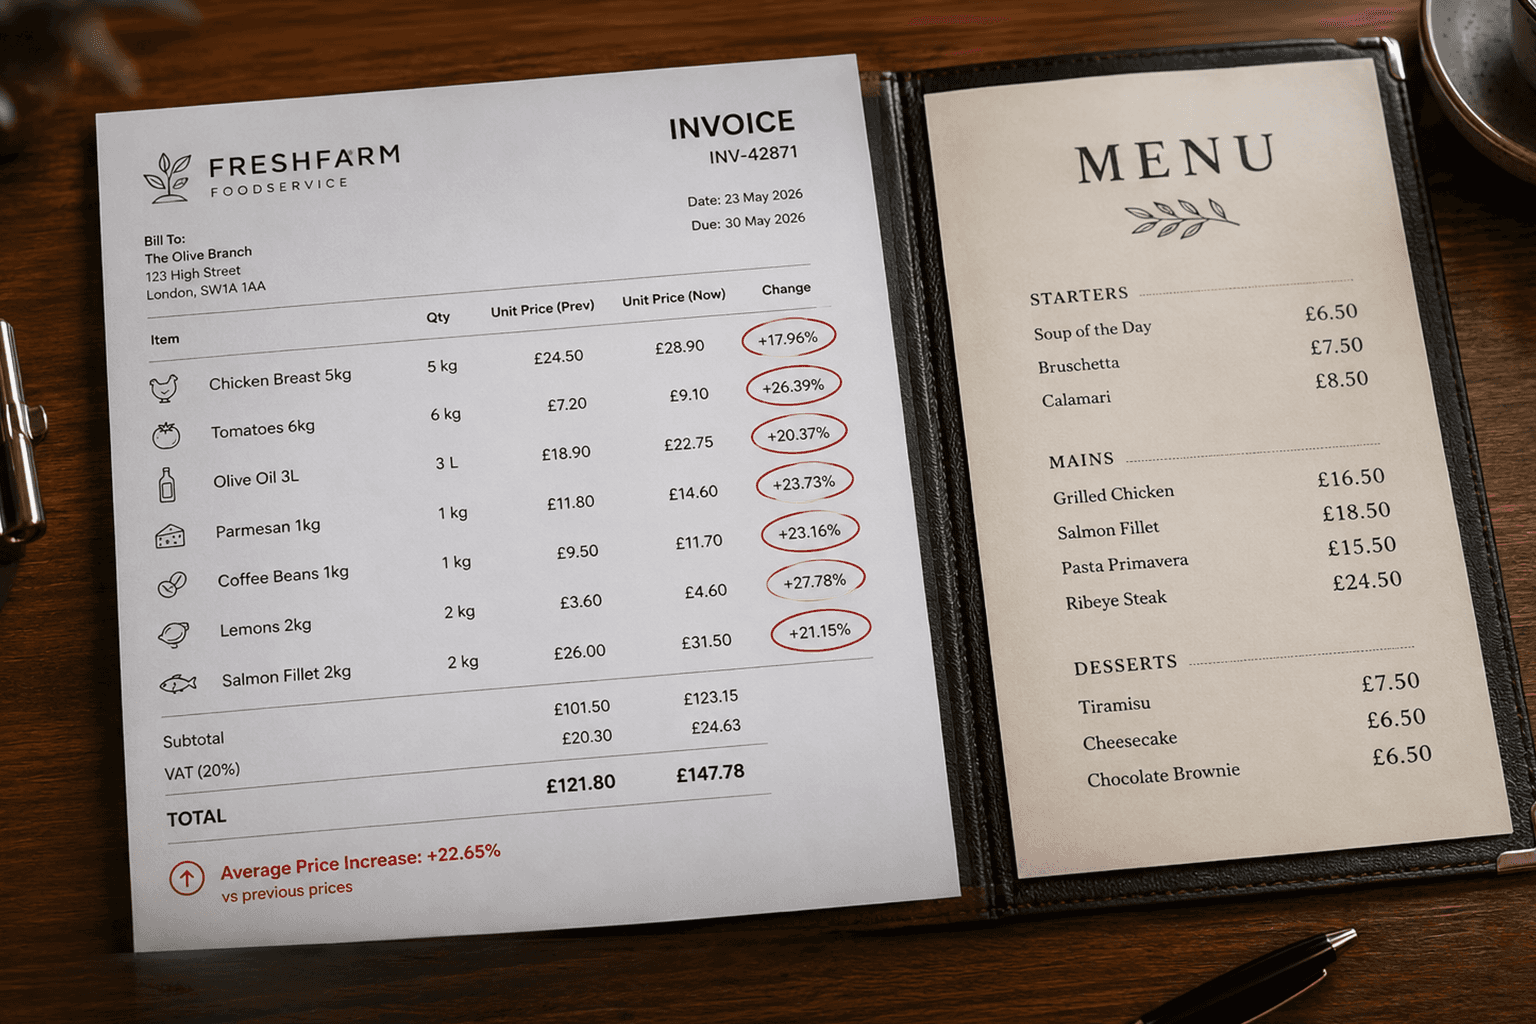
A 60-seat casual-dining spot in the Midwest ran the same menu, at the same prices, from January to December last year. Nothing changed on paper. But its fryer oil cost climbed 18% between Q1 and Q3 — in line with the 18.2% year-over-year jump in producer prices for fats and oils (Source: National Restaurant Association) — and its chicken thigh price rose from $2.10 a pound to $2.55. Nobody adjusted a single line item. By the time the owner pulled a P&L in November, the fried chicken sandwich that used to carry a 68% margin was sitting at 54%, and it was still the best-selling item on the menu, quietly bleeding the restaurant on every single order.
That's not a bad-luck story. It's the default outcome of running a static menu inside a food cost environment that isn't static at all.
The numbers behind the squeeze
The scale of this isn't anecdotal — it shows up consistently in industry-wide data:
Food costs are roughly 34-35% higher than pre-pandemic levels, and 82% of operators said their food costs were higher in 2025 than in 2024. (Source: National Restaurant Association)
Total restaurant operating expenses are up about 36% since 2019, with labor costs alone climbing 39% over the same stretch. (Source: National Restaurant Association)
Menu prices have risen roughly 27-31% - since 2019 — but operators would have needed a full 31% increase just to hold a 5% profit margin at pre-pandemic levels. Most didn't get there: 42% of operators reported being unprofitable in 2025. (Source: National Restaurant Association)
95% of full-service and 94% of limited-service operators now name food costs as their top business concern.
Cost movement isn't uniform across the menu. In the twelve months ending July 2025, producer prices for unprocessed finfish jumped 44.8%, fats and oils rose 18.2%, and beef and veal climbed 7.8% — while eggs fell 79% and pork dropped nearly 15% over the same window. A menu priced as a single average absorbs none of that nuance; a dish-by-dish view catches it.
Even the "moderate" headline numbers add up fast: full-service menu prices grew 4.9% year-over-year as of December 2025, and restaurant prices overall rose 3.9% year-over-year in one recent month — which on a $20 entrée is about 80 cents, and across 200 covers a night works out to roughly $5,000 in added guest spend a month if margin isn't tracked and priced accordingly. (Source: BLS data via Barmetrix)
The pattern across all of this: input costs and total expenses are moving in double digits over multi-year windows, while any single menu update usually only catches up on a handful of items at a time. That's the gap where margin erodes without anyone noticing until the annual review.
What flat pricing actually costs - dish by dish
Here's what that gap looks like on paper for a single dish — a grilled chicken sandwich, priced at $14.95 and untouched for twelve months. The ingredient movements below are illustrative, modeled on the real fats-and-oils and protein inflation rates cited above rather than pulled from one specific restaurant's books:
12 Months Ago | Today | |
Menu price | $14.95 | $14.95 |
Chicken thigh (6 oz) | $0.79 | $0.96 |
Cooking oil (portion) | $0.18 | $0.22 |
Bun + produce | $1.10 | $1.24 |
Sauce + packaging | $0.35 | $0.38 |
Total food cost | $2.42 | $2.80 |
Food cost % | 16.2% | 18.7% |
Gross margin | $12.53 (83.8%) | $12.15 (81.3%) |
A 2.5-point margin swing on one item looks small until it's multiplied across 40 dishes and a few hundred covers a night. On a menu doing 300 covers a day, a similar drift across the top 10 sellers can translate to $1,500-$2,500 a month in margin that never shows up as a "problem" on the P&L — it just shows up as a slightly worse bottom line that's hard to trace back to any single decision. That's consistent with the industry-wide picture: food and non-alcohol beverage costs sat at a median 32.0-32.4% of sales in 2024, meaning most operators are running close enough to the line that a two- or three-point drift on high-volume items is the difference between a healthy quarter and a flat one. (Source: National Restaurant Association Restaurant Operations Data Abstract)
Low-risk ways to start pricing dynamically
Dynamic pricing in restaurants doesn't have to mean surge pricing or anything that feels like an airline fare. A few entry points consistently show up as low-friction, both in practice and in how operators are already behaving in survey data:
Seasonal menu refreshes. Instead of one annual price update, rebuilding pricing on 15-20 core items every quarter — timed to a seasonal menu swap anyway — lets a restaurant absorb cost swings in smaller, less noticeable increments. A $0.50 adjustment four times a year reads differently to a regular than a sudden $2.00 jump in month twelve. This lines up with what the data shows working: menu-price growth has slowed to roughly 0.2-0.4% month over month as more operators spread out smaller, more frequent adjustments rather than one large annual correction — small enough that most guests don't register a single update as an "increase" at all. (Source: DoorDash 2025 menu-price analysis)
Weekday-versus-weekend pricing works well on genuinely high-demand items — a Friday-night steak special, a weekend brunch dish with a hard reservation cap. A $1-$2 premium on a Saturday-only version of a dish rarely draws complaints, because guests already expect weekend specials to be priced differently.
Limited-time pricing on slow-moving dishes does the opposite job: instead of protecting margin, it uses price to move inventory. A modest discount — 10-15% for a two-week window — on a dish sitting at low sales velocity can shift demand toward ingredients close to code-date or overstocked, protecting margin by cutting waste rather than by raising prices elsewhere. This mirrors what operators report already doing: 45% of restaurants surveyed said running time-specific discounts is one of their main levers for protecting margin as costs rise, alongside deals (46%) and added marketing (47%). (Source: Toast industry survey)
The trust risk is real — and the data says something counterintuitive about how to manage it
None of this works if it's handled clumsily, and guests notice price changes far more than operators might hope:
82% of U.S. consumers said they'd noticed restaurant prices rising noticeably over the past year, and only 28% said they felt current prices were fair. (Source: YouGov)
37% said they were dining out less as a direct result — a figure that climbs to 44% among lower-income households — and 69% of that group named price increases specifically as the reason, not general economic pressure. (Source: YouGov)
72% of diners believe restaurants are too expensive, per a study led by Cornell University's Sherri Kimes.
Here's the counterintuitive part: that same Cornell-affiliated research — an eye-tracking study across 358 participants — found that explaining a price increase on the menu, receipt, or at checkout had almost no measurable effect on guest loyalty or spending. Eye-tracking data showed diners' attention went straight to the dish and the price, largely skipping over the explanatory text next to it. Guests rated a restaurant as slightly "fairer" when a note was present, but it didn't change what or how much they ordered. The researchers' conclusion: guests judge a price by whether the experience feels worth it, not by whether the menu justified the number. (Source: Revenue Management Solutions / Cornell University)
That doesn't mean communication is pointless — it means where and how it happens matters more than whether it happens at all:
A short sourcing or seasonality note ("Gulf shrimp, market price," "seasonal citrus, subject to availability") does help guests feel a moving price is tied to something real, and roughly 70% of diners said they preferred restaurants proactively communicate when raising prices — even if that communication doesn't change their order. (Source: Toast survey)
Gradual, frequent adjustments beat sudden jumps. Three $0.50 increases spread across a year land softer than one $1.50 correction in December, even though the total change is identical — and it's the approach the slowing rate of monthly menu-price growth suggests more operators are already shifting toward.
The practical takeaway: skip the defensive menu paragraph explaining every price, but don't skip the discipline of moving prices in small, frequent steps instead of one uncomfortable correction once a year.
Catching the drift before it becomes a quarterly surprise
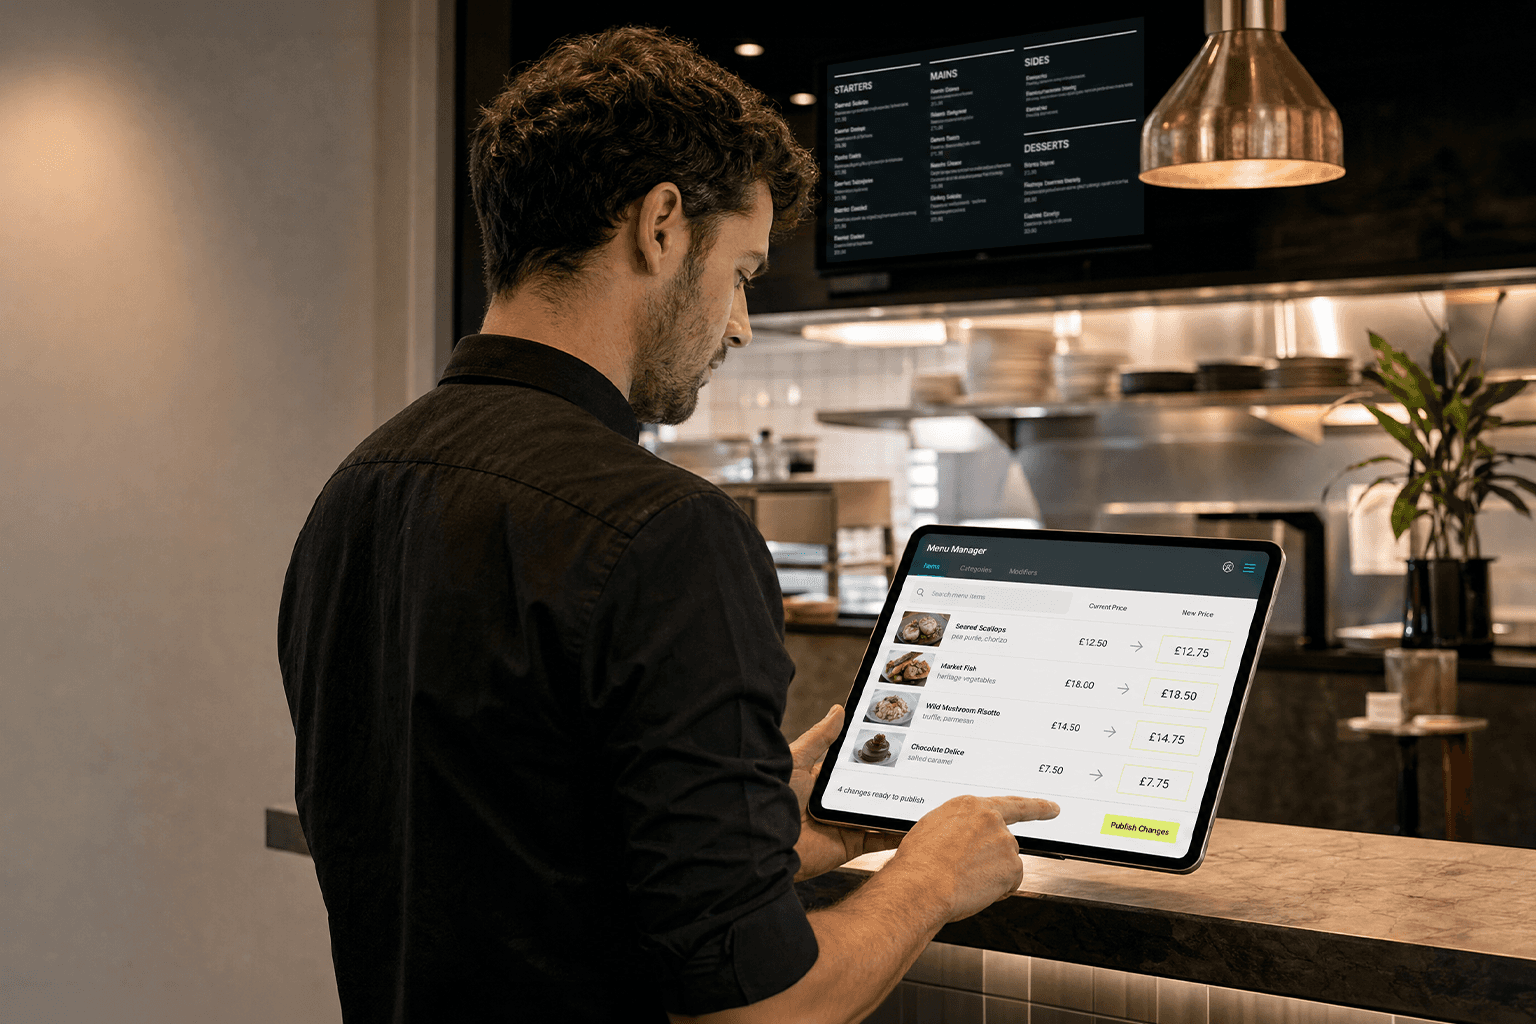
The chicken sandwich example above is exactly the kind of erosion that's invisible in a monthly sales report and obvious in a margin report — if anyone's building one dish by dish, every week. That's the gap Growtality's platform is built to close: automated margin tracking that flags when a specific dish's food cost percentage has crept past a set threshold, before it turns into a quarter of underpriced best-sellers. Instead of discovering the problem in a year-end P&L review, operators get a signal the week ingredient costs move — while there's still time to make a small, easy-to-explain adjustment instead of a big, uncomfortable one.
Try Growtality free and see which of your dishes are losing margin right now.